Robotic Arm ROI in the U.S. Manufacturing Market
- FAIRINO USA

- Mar 16
- 6 min read
Updated: Apr 19
Market Growth, ROI Curves, and Automation Adoption (With Professional Charts)
Introduction
Robotic arms have become one of the most transformative technologies in modern industry. Over the past two decades, automation has evolved from a tool used primarily by large automotive manufacturers to a widely accessible solution used across industries including electronics, logistics, food production, metal machining, pharmaceuticals, and even small workshops.
The core question most businesses ask before investing in automation is:
“How long will it take to see return on investment (ROI) from a robotic arm?”
The answer varies depending on several factors including labor costs, production volume, system complexity, and operational efficiency gains. However, industry studies consistently show that robotic automation typically achieves ROI within 12–24 months, with some applications reaching payback in 6–12 months.
This article examines the economics of robotic automation using professional charts and industry data covering:
robotics market growth
automation adoption trends
ROI curves for robotic arms
industry automation use cases
collaborative robot platforms such as FAIRINO
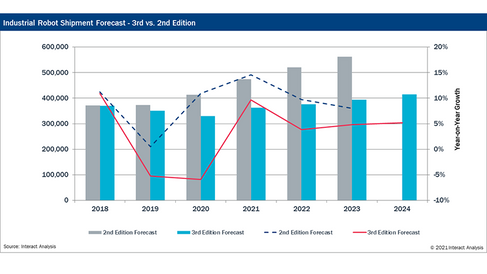
Global Industrial Robotics Market Growth
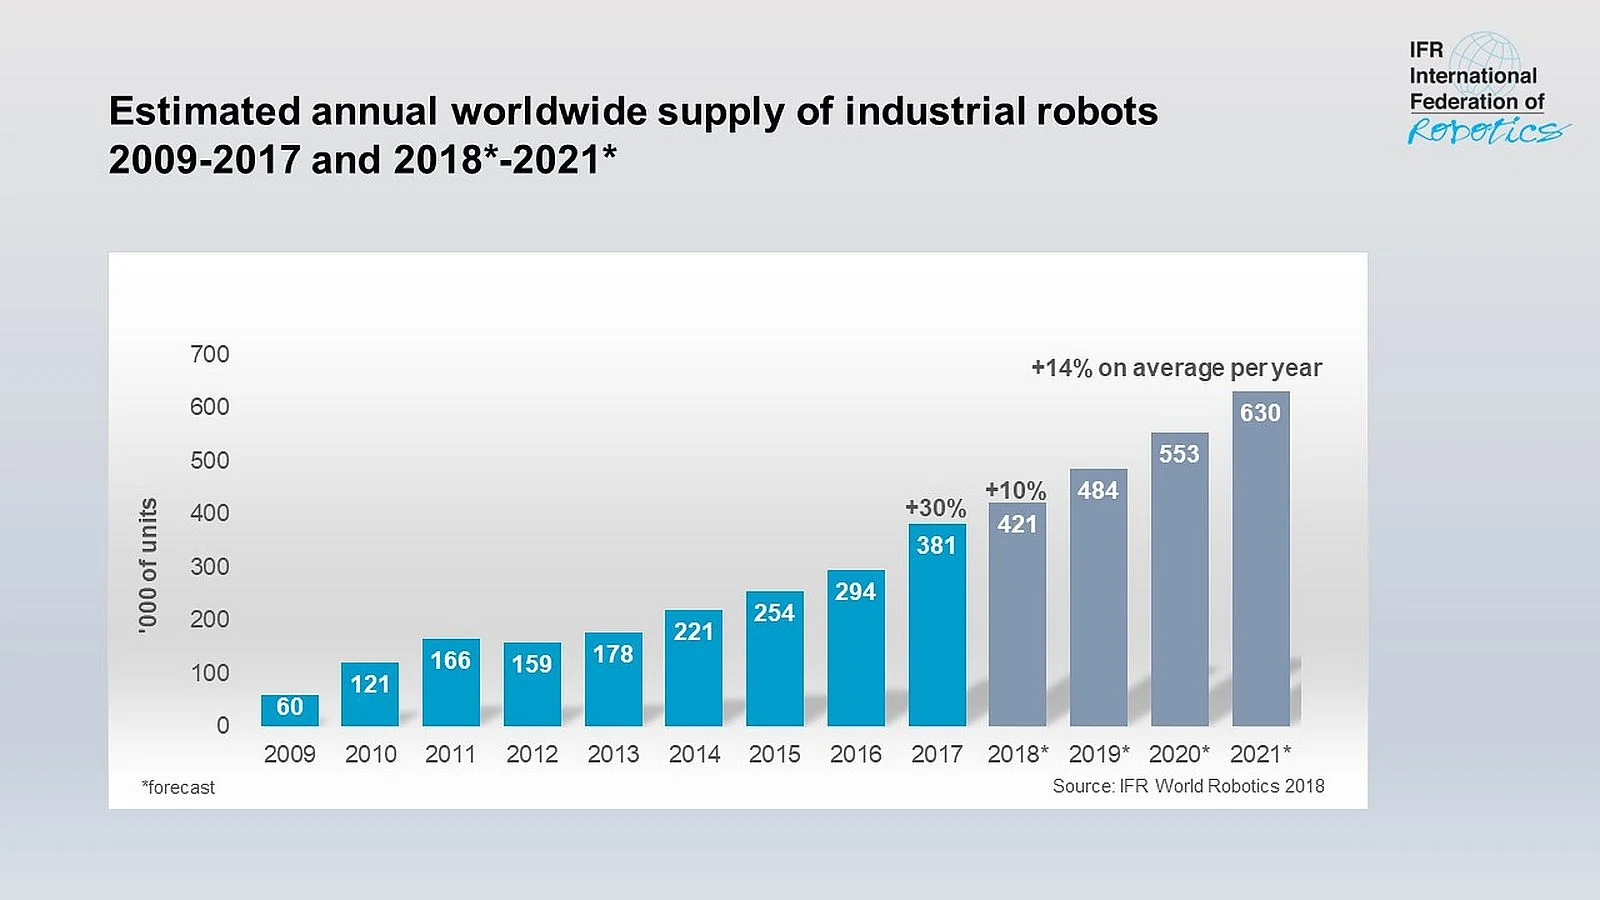
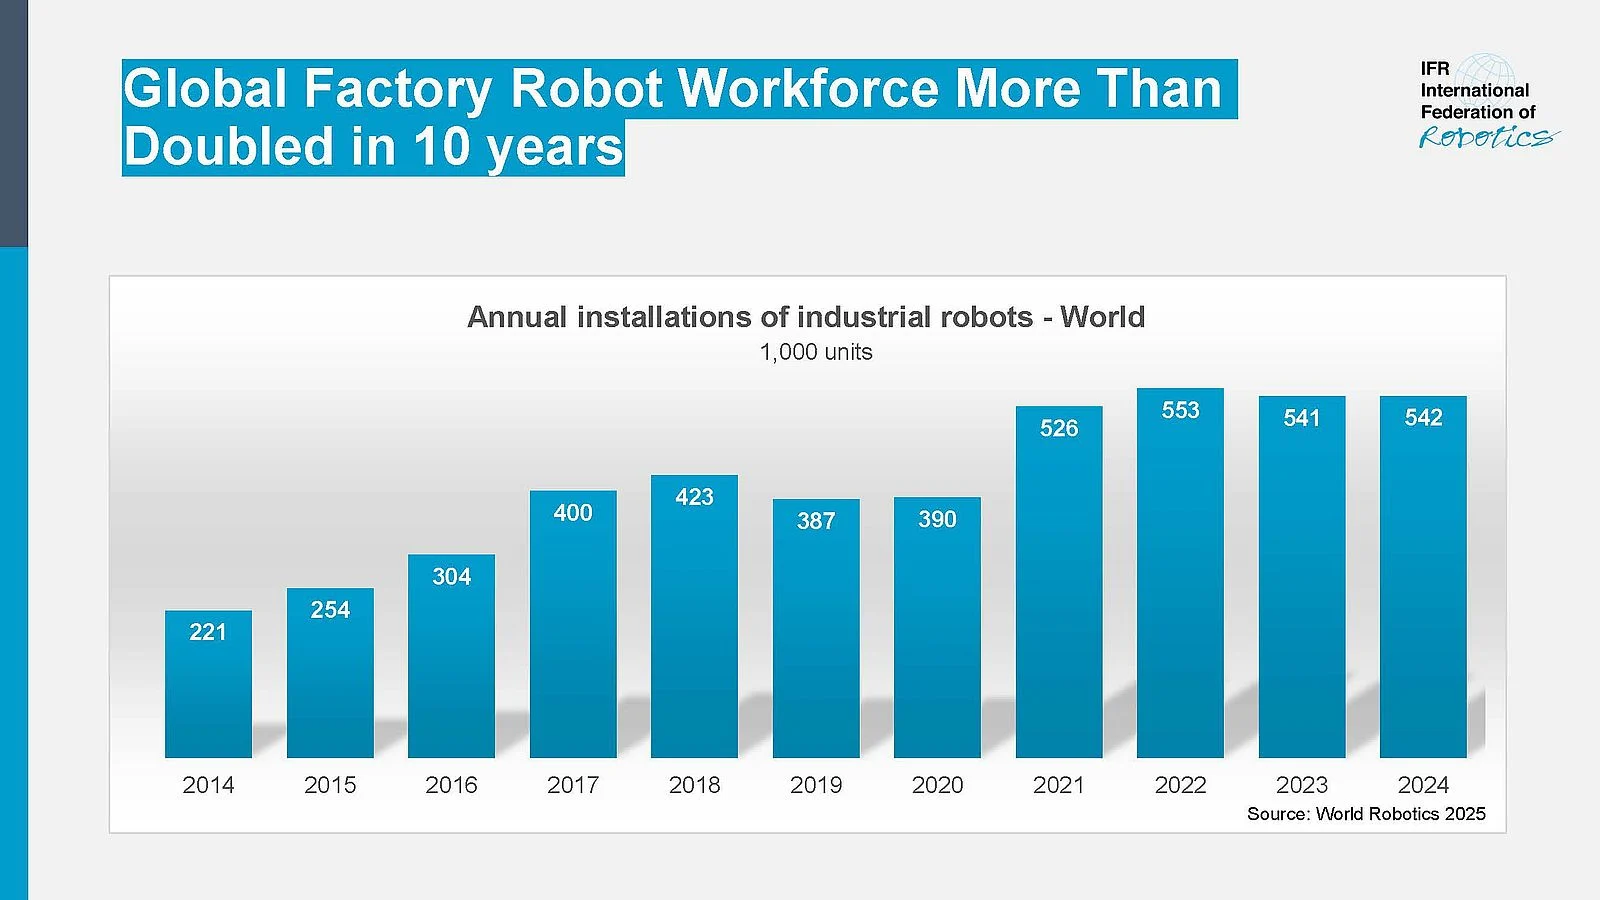

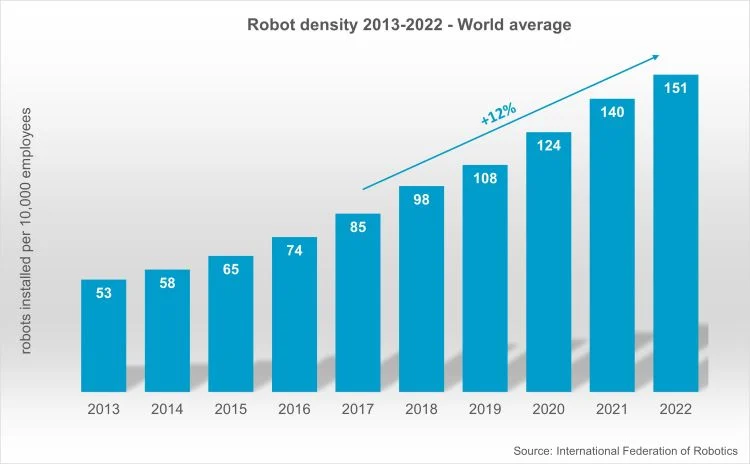
The robotics industry has experienced explosive growth in the past decade. According to the International Federation of Robotics, global installations of industrial robots have more than doubled since 2014.
Global Industrial Robot Installations
4
Year | Robots Installed |
2014 | 240,000 |
2018 | 422,000 |
2021 | 517,000 |
2024 | 542,000 |
Key Growth Drivers
Several macroeconomic trends are fueling robotics adoption worldwide:
Labor shortagesMany manufacturing industries struggle to fill repetitive manual labor roles.
Rising wagesLabor costs continue to rise in developed economies.
Supply chain resilienceManufacturers are reshoring production and investing in automation.
Quality demandsCustomers expect consistent product quality and faster delivery.
U.S. Robotics Market Adoption


Although the United States has historically lagged behind Asia in robotics adoption, automation investments are rapidly increasing due to labor shortages and manufacturing reshoring.
Industrial Robot Installations by Country
4
Country | Robots Installed (2024) |
China | 295,000 |
Japan | 44,500 |
United States | 34,200 |
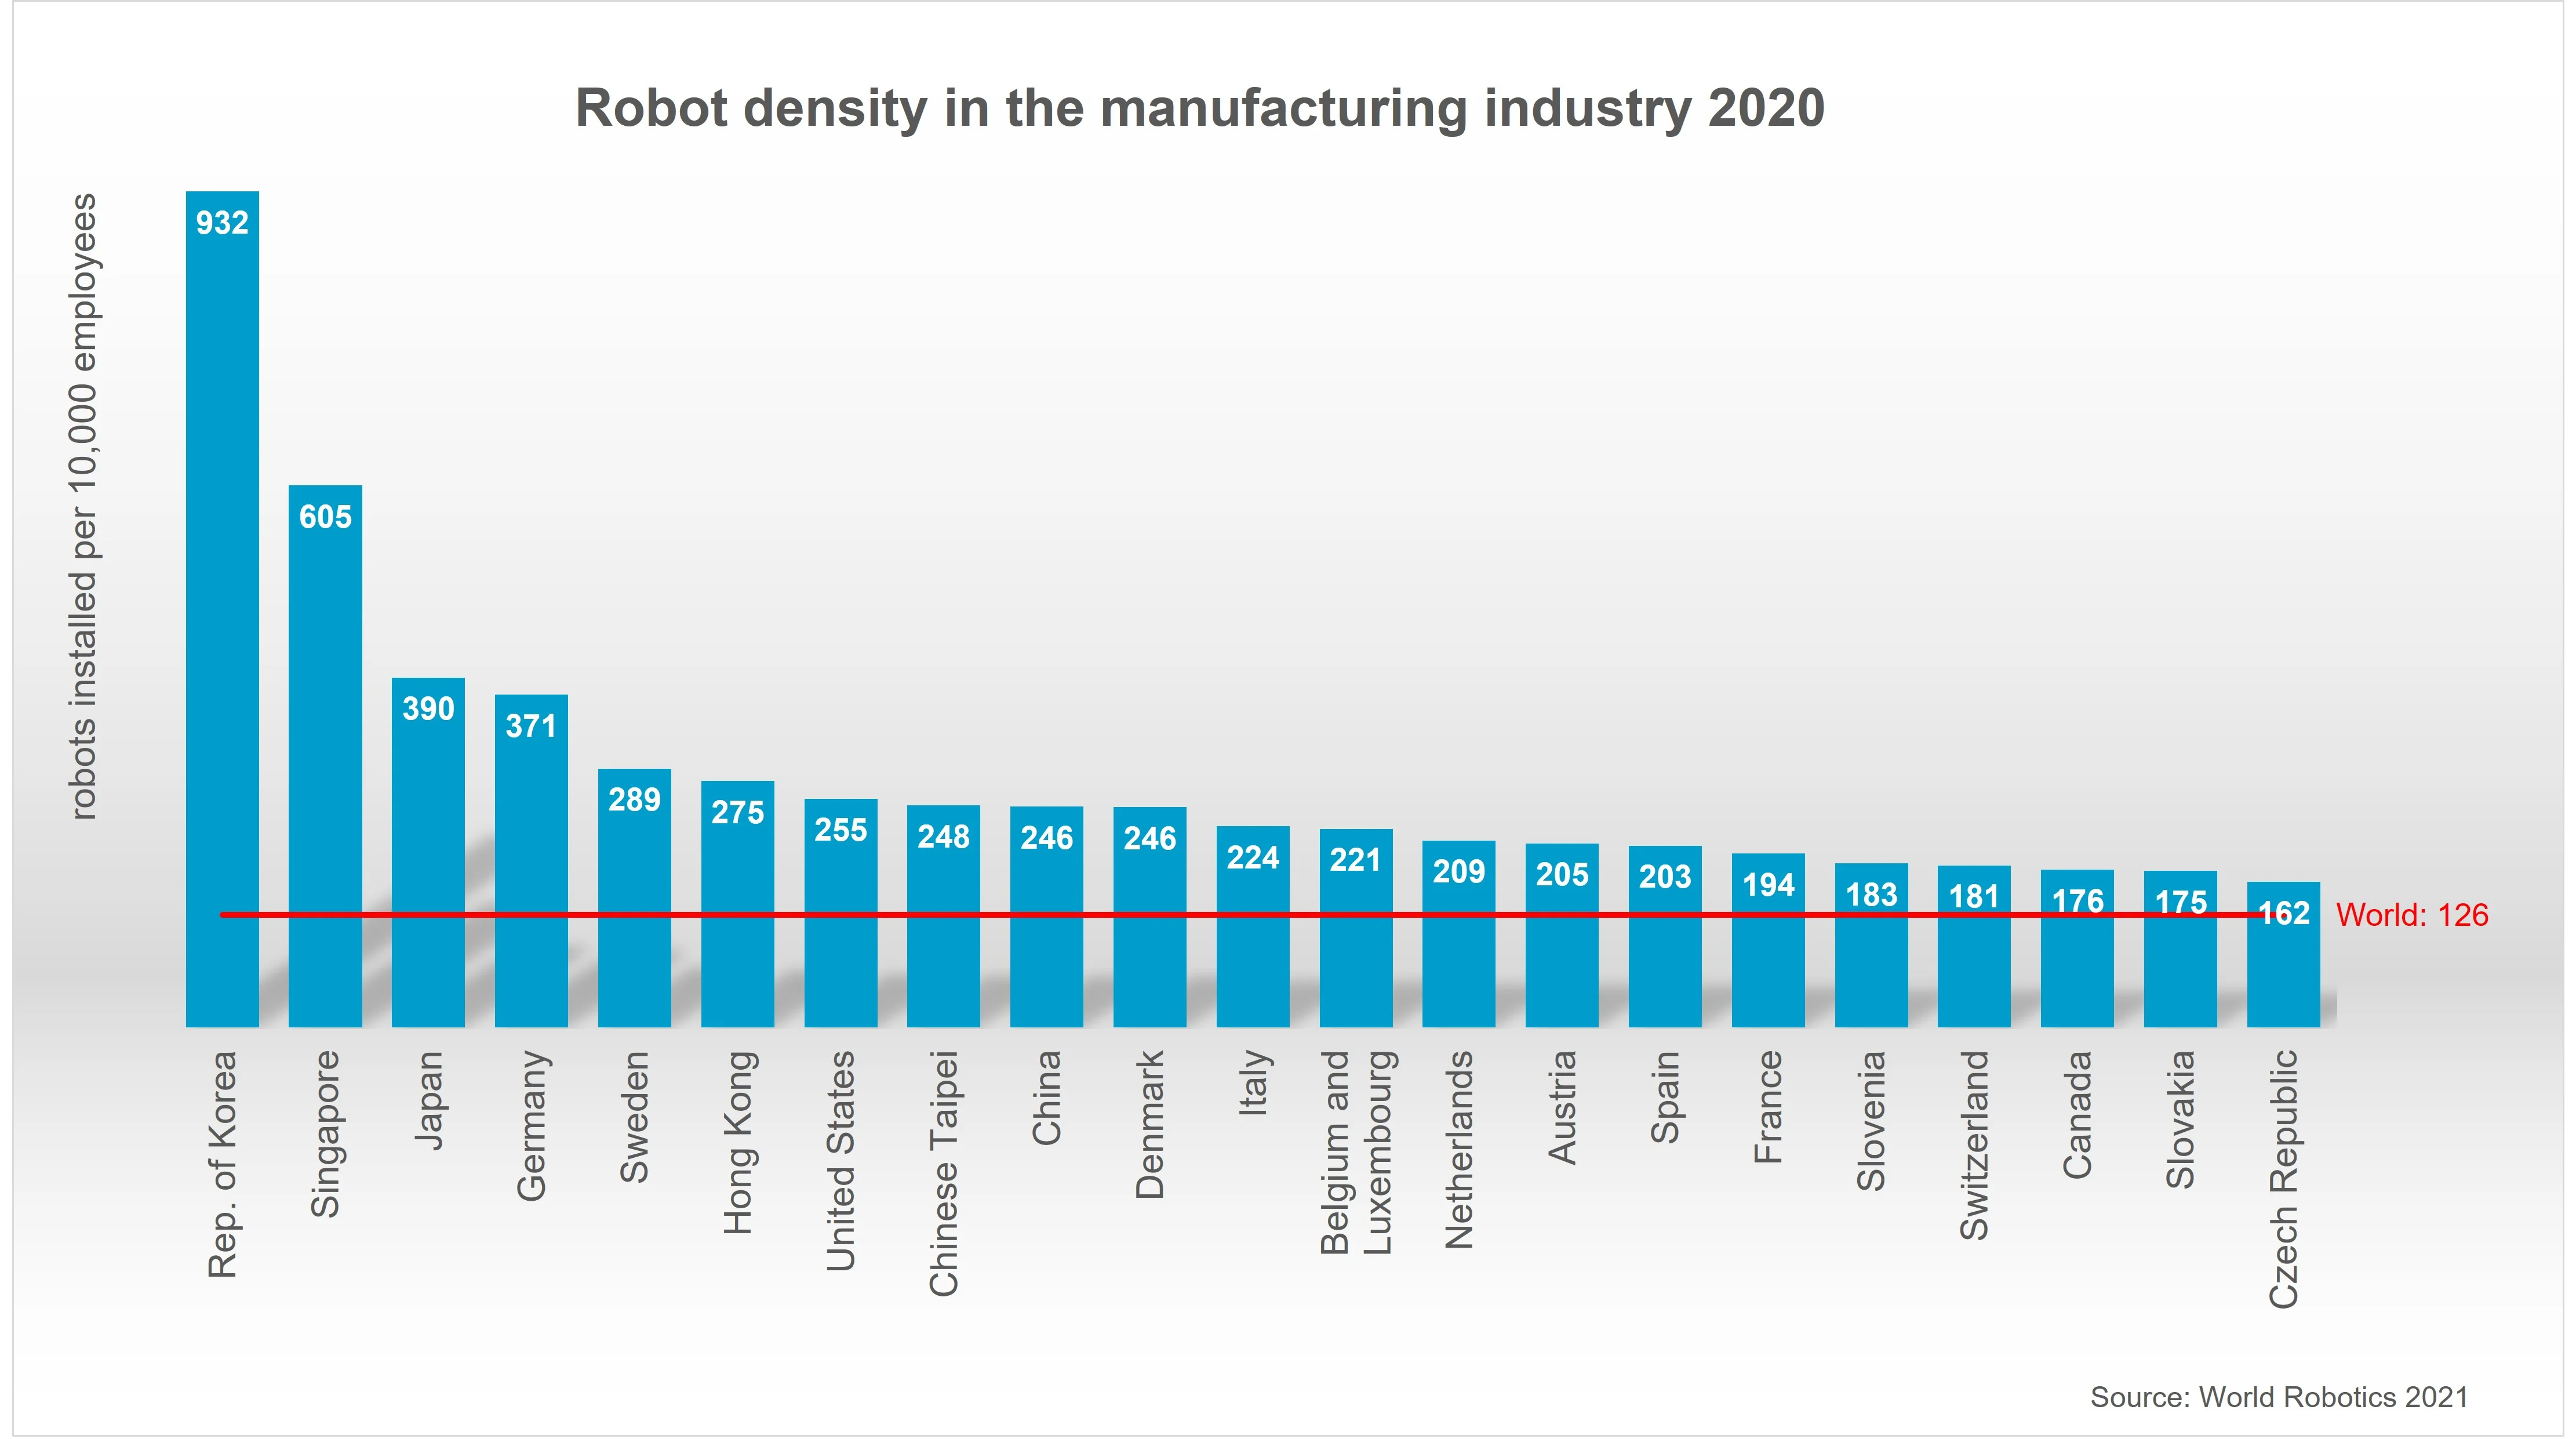
Robot Density (Robots per 10,000 Workers)
Country | Robot Density |
South Korea | 1,000+ |
Singapore | 670 |
Germany | 400 |
United States | ~285 |
The U.S. automation gap is expected to narrow significantly as companies accelerate robotics investments.
Automation Adoption by Industry

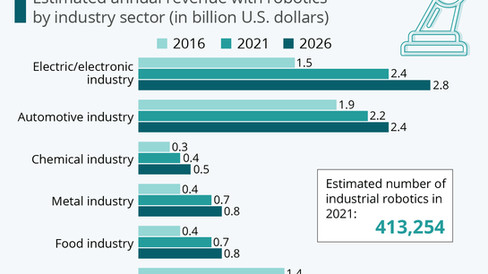


Robotics adoption varies widely across industries depending on production requirements, labor costs, and technical feasibility.
Robotics Adoption by Industry
Industry | Automation Level |
Automotive | Very High |
Electronics | High |
Metal Machining | Medium–High |
Logistics | Rapidly Growing |
Food Production | Medium |
Pharmaceuticals | Growing |
Automotive Manufacturing
Automotive factories are the most automated manufacturing environments in the world. Some factories use over 1,000 robotic arms performing welding, painting, and assembly.
Electronics Manufacturing
Electronics manufacturing requires micron-level precision, making robotic automation ideal for component placement and inspection.
Logistics and Warehousing
The growth of e-commerce has dramatically increased demand for warehouse automation, including robotic picking and palletizing systems.
Cost Structure of Robotic Automation
The total cost of implementing robotic automation includes several components beyond the robot itself.
Component | Typical Cost |
Robot Arm | $20,000 – $200,000 |
Integration | $30,000 – $150,000 |
End-of-arm tooling | $5,000 – $20,000 |
Safety systems | $5,000 – $50,000 |
Total automation systems typically cost:
$75,000 – $300,000
Collaborative robots often reduce these costs because they require less safety infrastructure and simpler integration.
ROI Curve for Robotic Automation
The return on investment for robotic automation follows a predictable curve. Initial investment occurs during installation, followed by increasing productivity gains that eventually exceed the original cost.
Automation ROI Curve


Typical ROI Timeline
Stage | Timeline |
Installation and setup | 0–3 months |
Early productivity gains | 3–6 months |
Break-even point | 12–18 months |
Strong profitability | 24+ months |
This curve explains why many companies report ROI within 1–2 years.
Example ROI Calculation
Consider a company automating a packaging process.
Investment
Item | Cost |
Robot | $40,000 |
Integration | $25,000 |
Tooling | $10,000 |
Total investment:
$75,000
Labor Replacement
| Workers replaced | 2 || Annual labor cost per worker | $50,000 |
Annual savings:
$100,000
Payback Period
$75,000 ÷ $100,000 = 0.75 years
ROI achieved in 9 months.
Productivity Gains from Robotics
Automation often produces productivity improvements beyond labor savings.
Metric | Improvement |
Production speed | +30–50% |
Defect reduction | −20–80% |
Machine utilization | +20–40% |
Labor cost reduction | −30–60% |
These gains accelerate ROI and improve long-term profitability.
Collaborative Robots and FAIRINO
Collaborative robots (cobots) represent one of the fastest-growing segments of the robotics industry.
Cobots are designed to operate safely alongside human workers and offer several advantages:
lower cost
easier programming
flexible deployment
minimal safety barriers
FAIRINO is an emerging collaborative robot manufacturer focused on affordable industrial automation.
FAIRINO Robot Models
Model | Payload |
FR3 | 3 kg |
FR5 | 5 kg |
FR10 | 10 kg |
FR16 | 16 kg |
FR20 | 20 kg |
These robots are commonly used for:
machine tending
electronics assembly
packaging
inspection
Because collaborative robots are less expensive than traditional industrial robots, they often achieve ROI faster.
Automation Adoption Forecast
robotic arm statistics
The robotics market is expected to grow rapidly over the next decade.
Industrial Robotics Market Forecast


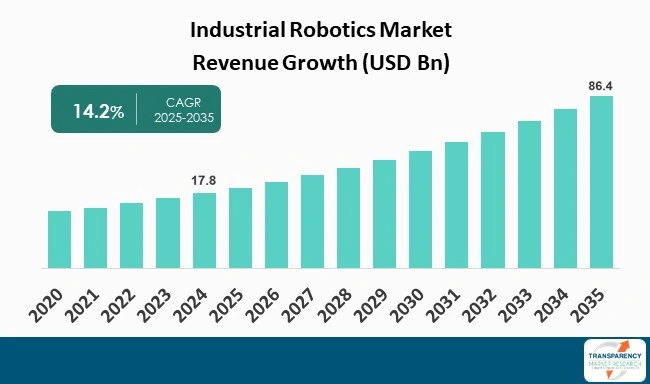
Year | Market Size |
2023 | $55B |
2025 | $75B |
2030 | $160B+ |
The growth of robotics will be driven by:
AI-powered automation
collaborative robots
smart factories
logistics automation
Long-Term ROI of Robotic Automation
While many companies focus on short-term payback periods, the long-term ROI of automation can be much greater.
Industrial robots typically operate for 10–15 years, producing savings long after the initial investment is recovered.
Lifetime ROI may exceed 300–400 percent depending on the application.
Conclusion
Robotic arms are becoming an essential component of modern manufacturing and logistics operations. Although automation requires upfront investment, the financial benefits are substantial.
Typical ROI timelines include:
Automation Type | ROI Timeline |
Simple cobot cell | 6–12 months |
Machine tending | 8–12 months |
Packaging automation | 12–18 months |
Large factory automation | 18–36 months |
As robotics technology continues to advance and become more affordable, automation will become increasingly accessible to companies of all sizes.
Collaborative robots such as those developed by FAIRINO are playing a key role in this transformation by lowering the barriers to automation adoption.
Companies that invest in robotics today will be better positioned to compete in the increasingly automated manufacturing landscape of the future.
FAQ
What is the typical ROI timeline for robotic arms in the U.S. manufacturing market?
Most robotic arm systems in the U.S. manufacturing sector achieve return on investment within 12 to 24 months, with some high-efficiency applications reaching payback in as little as 6 to 12 months.
Why is robotic automation growing rapidly in the United States?
Robotic adoption in the U.S. is accelerating due to:
labor shortages
rising wages
reshoring of manufacturing
increasing demand for consistent quality
These factors are pushing companies to invest in automation to remain competitive.
How does the U.S. compare globally in robotic automation adoption?
The United States currently lags behind leading countries like South Korea and Germany in robot density, but adoption is increasing rapidly as companies invest more in automation technologies.
What industries in the U.S. benefit most from robotic arm automation?
Robotic arms are widely used across:
automotive manufacturing (very high automation)
electronics production
metal machining
logistics and warehousing
food production and pharmaceuticals
Each industry benefits from improved efficiency and scalability.
What is the typical cost structure of robotic automation systems?
The total cost of robotic automation includes:
robotic arm: $20,000 – $200,000
integration: $30,000 – $150,000
tooling: $5,000 – $20,000
safety systems: $5,000 – $50,000
Total system cost typically ranges from $75,000 to $300,000.
Why do collaborative robots achieve faster ROI?
Collaborative robots (cobots) often achieve faster ROI because:
they require less safety infrastructure
integration is simpler
upfront costs are lower
This reduces total investment and accelerates payback.
What factors influence robotic arm ROI in the U.S. market?
Key ROI drivers include:
labor cost savings
production volume
automation complexity
operational efficiency gains
These factors determine how quickly the system pays for itself.
What is the ROI curve for robotic automation?
Robotic automation follows a predictable ROI curve:
initial investment phase
gradual productivity gains
eventual break-even point
long-term profitability
Over time, savings exceed the original investment.
What is the long-term ROI of robotic arms?
Industrial robotic systems typically operate for 10–15 years, and lifetime ROI can exceed 300%–400%, making automation a highly profitable long-term investment.
Why is robot adoption expected to increase in the U.S.?
The U.S. automation gap compared to other countries is expected to narrow as companies:
invest in robotics
modernize production
address workforce shortages
This will lead to significant growth in robotic installations.
What are common applications of robotic arms in U.S. manufacturing?
Robotic arms are commonly used for:
machine tending
assembly
packaging
inspection
These applications are highly repeatable and generate strong ROI.
How does robotic automation improve manufacturing efficiency?
Robotic systems improve efficiency by:
increasing machine utilization
reducing downtime
enabling continuous production
improving consistency
This leads to higher output and better financial performance.

