📘 THE COMPLETE GUIDE TO BUSINESS AUTOMATION (2026) PART 2
- FAIRINO USA

- Mar 24
- 6 min read
Updated: Apr 19
PART 2 — ADVANCED FINANCIAL MODELS, SYSTEM ARCHITECTURE, AND INDUSTRY TRANSFORMATION
11. ADVANCED FINANCIAL MODELING FOR BUSINESS AUTOMATION
Most businesses evaluate automation using simple payback periods. While useful, this approach is incomplete and often misleading. A serious automation strategy requires deeper financial analysis using:
Net Present Value (NPV)
Internal Rate of Return (IRR)
Total Cost of Ownership (TCO)
Opportunity Cost Analysis
11.1 NET PRESENT VALUE (NPV)
NPV measures the value of future cash flows discounted to present value.
NPV=∑t=0nCt(1+r)tNPV = \sum_{t=0}^{n} \frac{C_t}{(1+r)^t}NPV=∑t=0n(1+r)tCt
Where:
CtC_tCt = cash flow at time t
rrr = discount rate
nnn = number of periods
Practical Example
Let’s assume:
Initial investment: $50,000
Annual savings: $120,000
Discount rate: 10%
Time horizon: 3 years
NPV Calculation (approx):
Year 1: 120,000 / 1.1 = 109,090
Year 2: 120,000 / 1.21 = 99,174
Year 3: 120,000 / 1.331 = 90,158
Total discounted cash flow ≈ $298,422
NPV = $298,422 – $50,000 = $248,422
👉 This indicates extremely strong financial viability.
11.2 INTERNAL RATE OF RETURN BUSINESS AUTOMATION (IRR)
IRR is the discount rate where NPV = 0.
For automation projects like this:
IRR typically ranges between 80% – 200%
This is significantly higher than:
Real estate (~8–15%)
Stock market (~7–10%)
👉 Automation is often one of the highest-return investments available to a business.
11.3 TOTAL COST OF OWNERSHIP (TCO)
Businesses often underestimate TCO.
Full TCO Includes:
Purchase cost
Integration cost
Downtime during installation
Maintenance
Training
Upgrades
Example TCO (3 Years)
Cost Category | Amount |
Initial Setup | $50,000 |
Maintenance | $6,000 |
Downtime Loss | $5,000 |
Training | $3,000 |
Total TCO: $64,000
11.4 OPPORTUNITY COST
The most overlooked factor.
If you do not automate, you lose:
Market share
Speed advantage
Pricing competitiveness
Automation is not just ROI—it is survival ROI.
12. FULL AUTOMATION SYSTEM ARCHITECTURE
Automation is most effective when implemented as a system, not isolated tools.
12.1 THE FOUR-LAYER ARCHITECTURE
Layer 1 — Physical Execution (Robotics)
Fairino robotic arms
Conveyor systems
Sensors
Layer 2 — Control Systems
PLC (Programmable Logic Controllers)
Robot controllers
Machine interfaces
Layer 3 — Data & Intelligence
AI models
Analytics dashboards
Predictive maintenance
Layer 4 — Business Systems
ERP
CRM
Supply chain management
12.2 HOW THESE LAYERS INTERACT
Example workflow:
Customer order enters CRM
ERP processes order
System sends command to production
Robot executes task
Data feeds back into analytics system
This creates a closed-loop system.
13. CASE STUDY 3 — LOGISTICS & WAREHOUSING (DETAILED)
Background
A mid-sized e-commerce fulfillment center processing 5,000 orders/day faced:
Increasing delivery delays
Labor shortages
High error rates in order picking
Implementation
The company introduced:
4 Fairino robotic arms for sorting and packing
Conveyor-based routing system
AI-driven order batching
Technical Setup
Each robotic station performed:
Barcode scanning
Item identification
Box selection
Packing and sealing
Cycle time:
Reduced from 90 seconds → 25 seconds per order
Results
Metric | Before | After |
Orders/day | 5,000 | 12,000 |
Error rate | 3% | 0.5% |
Labor | 40 עובדים | 18 עובדים |
Financial Impact
Annual labor savings: ~$600,000
Automation cost: ~$200,000
Payback period: 4 months
14. CASE STUDY 4 — HEALTHCARE (LAB AUTOMATION)
Problem
Medical laboratories face:
High precision requirements
Risk of contamination
Labor-intensive workflows
Solution
Robotic automation for:
Sample handling
Test preparation
Sorting
Results
Processing speed increased by 200%
Human error reduced by 90%
Lab capacity doubled
Strategic Insight
Automation in healthcare is not just cost-saving—it is risk reduction and accuracy enhancement.
15. CASE STUDY 5 — RETAIL & MICRO-FULFILLMENT
4
Background
Retailers are shifting toward:
Same-day delivery
Micro-fulfillment centers
Implementation
Automation included:
Robotic picking arms
AI inventory systems
Compact storage grids
Results
Order preparation time ↓ 70%
Store footprint ↓ 50%
Delivery speed ↑ significantly
16. AI + ROBOTICS INTEGRATION
The next evolution of automation is combining robotics with artificial intelligence.
16.1 EXAMPLES OF INTEGRATION
Predictive Maintenance
AI detects when a robot will fail before it happens.
Vision Systems
Robots identify objects dynamically.
Demand Forecasting
Production adjusts automatically to demand.
16.2 IMPACT
Downtime reduced by up to 50%
Efficiency increased by 20–40%
17. COMMON FAILURE POINTS IN AUTOMATION
Even well-funded automation projects fail.
17.1 OVER-AUTOMATION
Trying to automate everything at once leads to:
Complexity
System breakdowns
17.2 POOR PROCESS DESIGN
Automation cannot fix bad processes.
17.3 UNDERTRAINED STAFF
Employees must understand:
System operation
Troubleshooting
Maintenance
18. INDUSTRY TRANSFORMATION ANALYSIS
18.1 RESTAURANTS
Fully automated kitchens emerging
Labor reduction up to 70%
18.2 MANUFACTURING
Smart factories becoming standard
Near-zero defect production possible
18.3 LOGISTICS
Autonomous warehouses scaling globally
18.4 HEALTHCARE
Precision automation improving outcomes
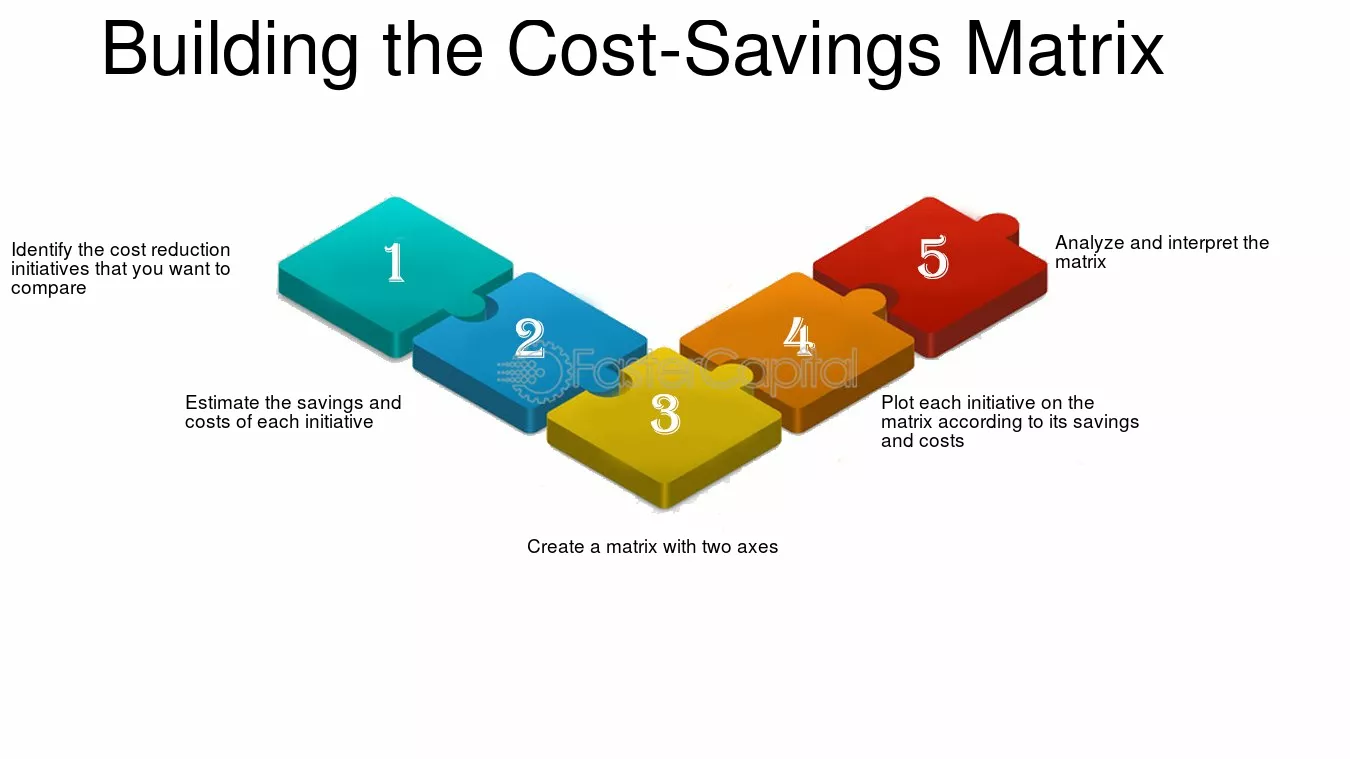
19. FULL IMPLEMENTATION CHECKLIST
A serious automation rollout should follow this structure:
Phase 1 — Analysis
Map processes
Calculate ROI
Identify bottlenecks
Phase 2 — Design
Select technology
Design workflow
Plan integration
Phase 3 — Deployment
Install systems
Train staff
Run pilot
Phase 4 — Optimization
Collect data
Improve performance
Scale operations
20. FINAL STRATEGIC INSIGHT
Automation is not about replacing humans.
It is about:
Replacing inefficiency
Scaling intelligently
Competing globally
FINAL CONCLUSION
The businesses that will dominate the next decade are not necessarily the largest—but the most automated, the most efficient, and the most adaptable.
Automation is not a trend.
It is the new operational foundation of modern business.
📊 INFOGRAPHICS — PART 2 (VISUAL)
7. Automation Financial Model


Insight:Visualizes how investment turns into long-term financial gain.
8. NPV & IRR Explained


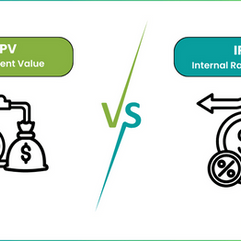

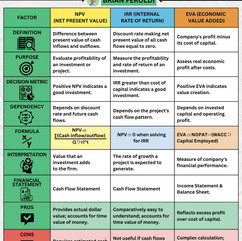


Insight:Helps decision-makers understand deeper financial evaluation beyond simple ROI.
9. Smart Automation Architecture (Closed Loop)
Insight:Demonstrates how data flows continuously between systems and machines.
10. Warehouse Automation Transformation


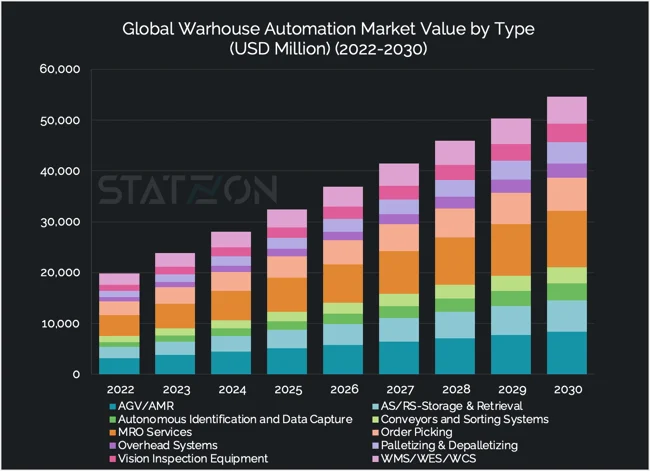
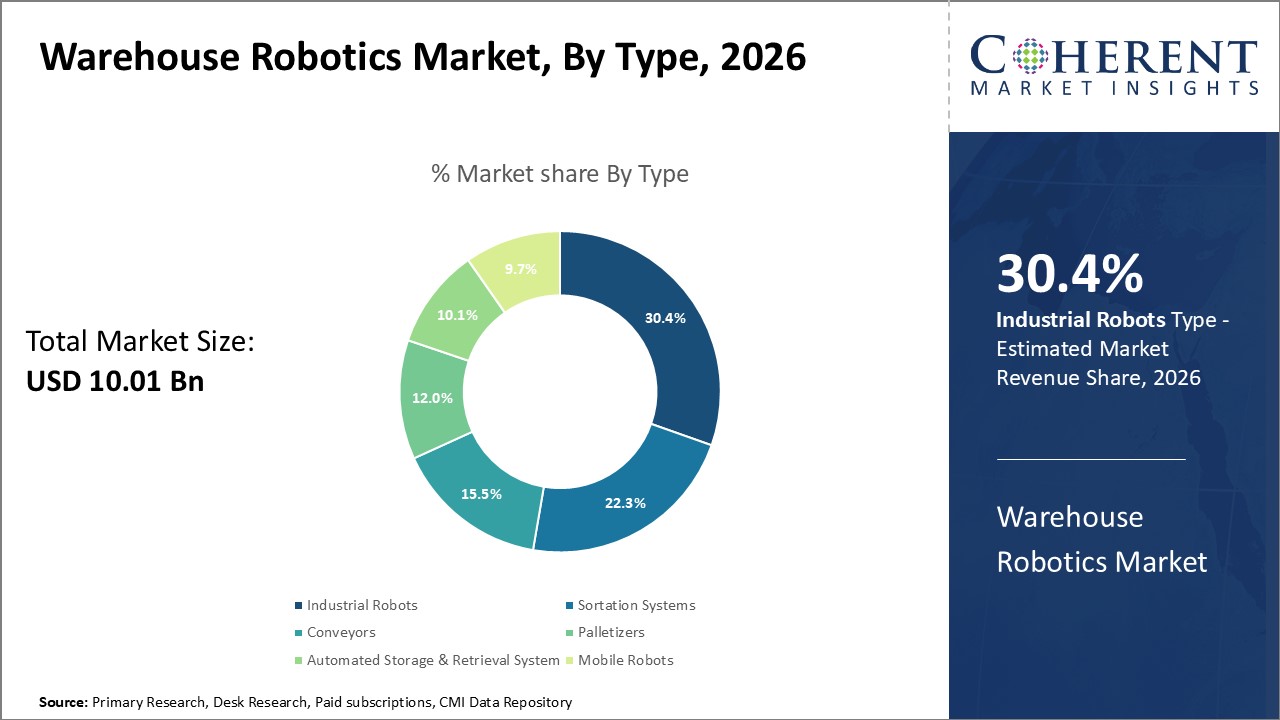


Insight:Clearly shows throughput increase and error reduction after automation.
11. AI + Robotics Integration

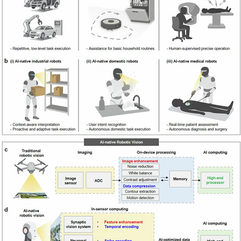


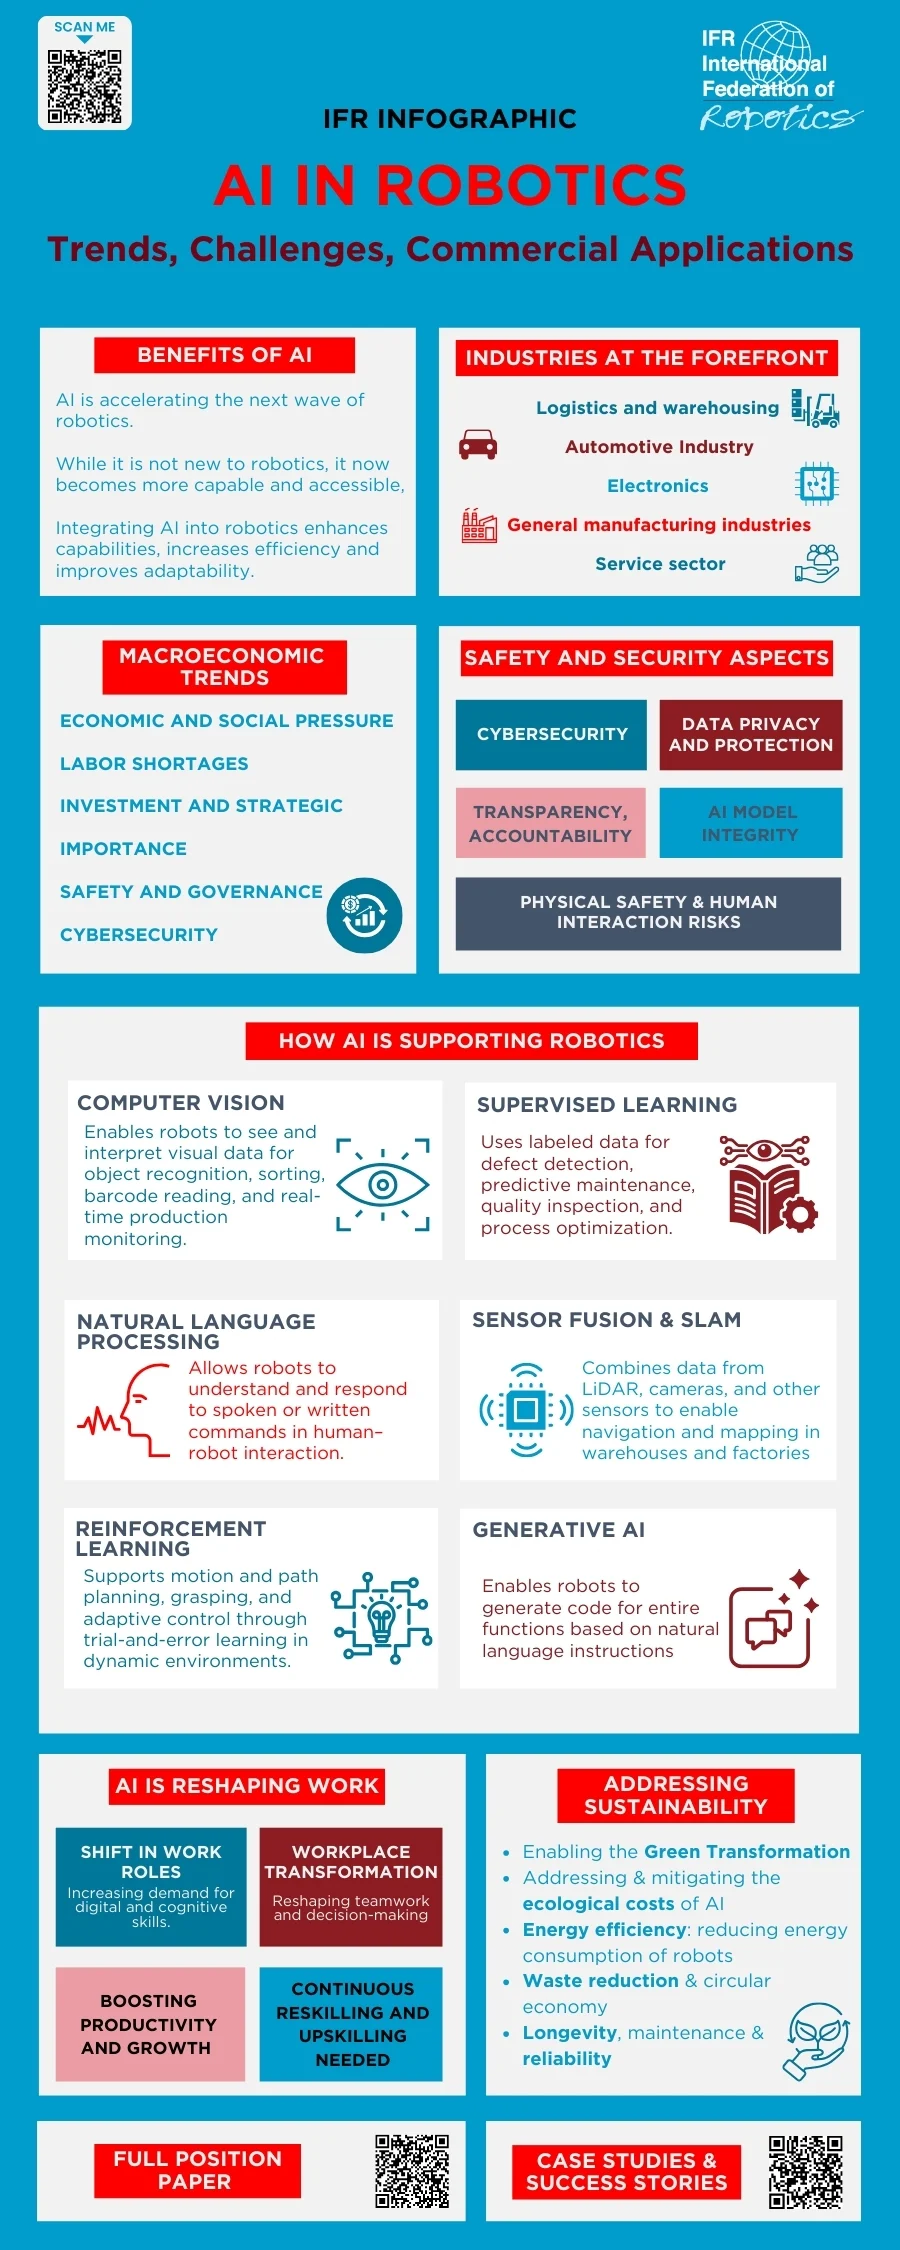
Insight:Explains how AI enhances robotic capabilities beyond basic automation.
12. Why Automation Projects Fail

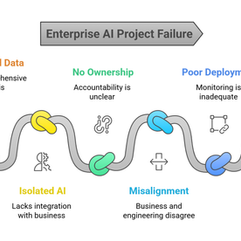


Insight:Highlights the most common strategic mistakes businesses make.
13. Automation Maturity Model

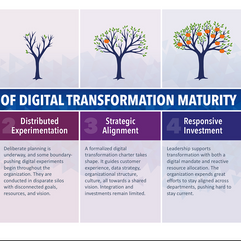


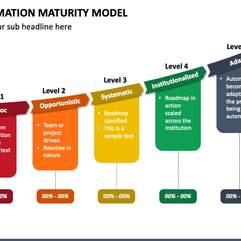
Insight:Shows progression from manual processes to fully autonomous systems.
14. 12-Month Automation Roadmap


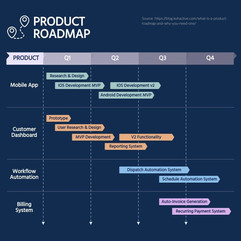
Insight:Provides a realistic timeline for implementation and scaling.
15. Executive Decision Dashboard


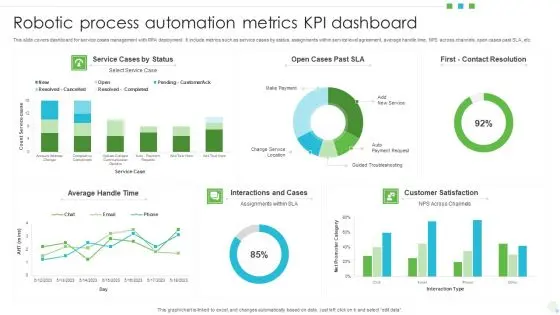


Insight:Summarizes how leadership should evaluate automation success.
FAQ
What is advanced ROI modeling in business automation?
Advanced ROI modeling analyzes automation performance across different operational scenarios rather than using a single fixed model. It considers variables like production volume, labor availability, product mix, and quality requirements to provide a more accurate financial picture.
Why is a single ROI model not accurate for automation projects?
A single ROI model is inaccurate because automation outcomes vary significantly depending on the production environment. Factors such as demand levels, workforce constraints, and quality standards can drastically change how value is generated.
How does automation ROI differ in high-volume manufacturing?
In high-volume environments, ROI is primarily driven by throughput increase and capacity expansion, rather than labor savings. Robots enable significantly higher production output, which leads to large revenue gains.
How do robotic systems create ROI in labor-constrained businesses?
In labor-constrained environments, automation does not just reduce costs—it prevents lost revenue. Robots allow companies to maintain production levels despite workforce shortages, stabilizing operations and avoiding missed business opportunities.
How does automation improve ROI in quality-sensitive industries?
In industries where defects are costly, robotic automation improves ROI by reducing defect rates and rework costs. Even small improvements in quality can lead to significant financial savings at scale.
What are the three main ROI scenarios in automation?
Automation ROI typically falls into three categories:
high-volume production (throughput-driven ROI)
labor-constrained operations (capacity stabilization)
quality-sensitive production (defect reduction)
Each scenario has a different primary financial driver.
How does production volume impact automation ROI?
Higher production volumes amplify the financial impact of automation by increasing output, improving efficiency, and maximizing the return generated from robotic systems.
Why is defect reduction a major ROI driver?
Defects create hidden costs such as material waste, rework, and customer dissatisfaction. Automation reduces variability, leading to consistent quality and significant cost savings over time.
How does automation help scale manufacturing operations?
Automation enables scalable production by:
increasing throughput without proportional labor increases
maintaining consistent quality at higher volumes
reducing operational bottlenecks
This allows businesses to grow without being limited by workforce or manual processes.
What is the biggest mistake companies make when evaluating automation ROI?
The most common mistake is focusing only on labor cost savings, while ignoring other major value drivers like:
increased production capacity
reduced defects
avoided revenue loss
improved operational stability
How does automation reduce operational risk?
Automation reduces risk by:
ensuring consistent production output
minimizing dependence on labor availability
improving quality control
This leads to more predictable and stable operations.
What role does automation play in long-term business growth?
Automation supports long-term growth by enabling businesses to:
scale production efficiently
maintain quality standards
respond to market demand faster
It transforms operations from reactive to strategically optimized systems.

